Kyoto Encyclopedia of Genes and Genomes Enrichment Analysis
Example of an expected search result
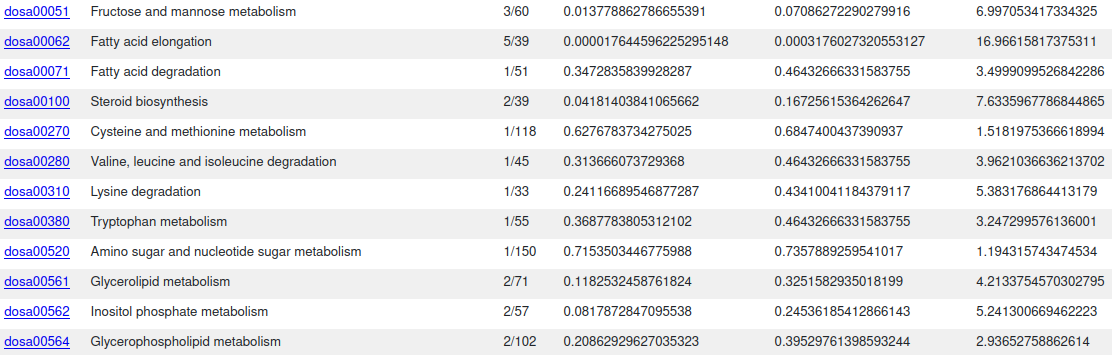
Interactive table with KEGG enrichment analysis data (image captured below)
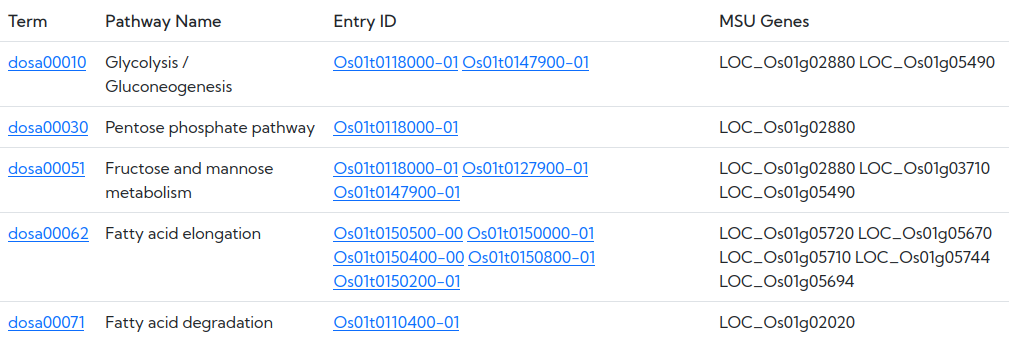
Clickable hyperlinked table with KEGG pathway and associated gene data (image captured below)
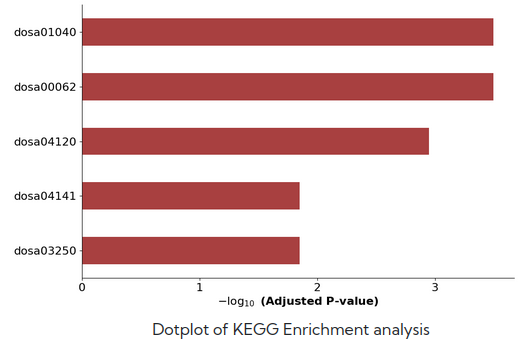
Bar plot of top 10 KEGG terms ranked by “Adjusted P-value” (image captured below)
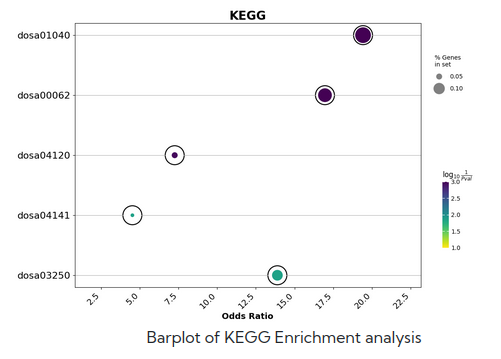
Dot plot of top 10 KEGG terms ranked by “Adjusted P-value” (image captured below)