Gene Ontology Enrichment Analysis
Example of an expected search result
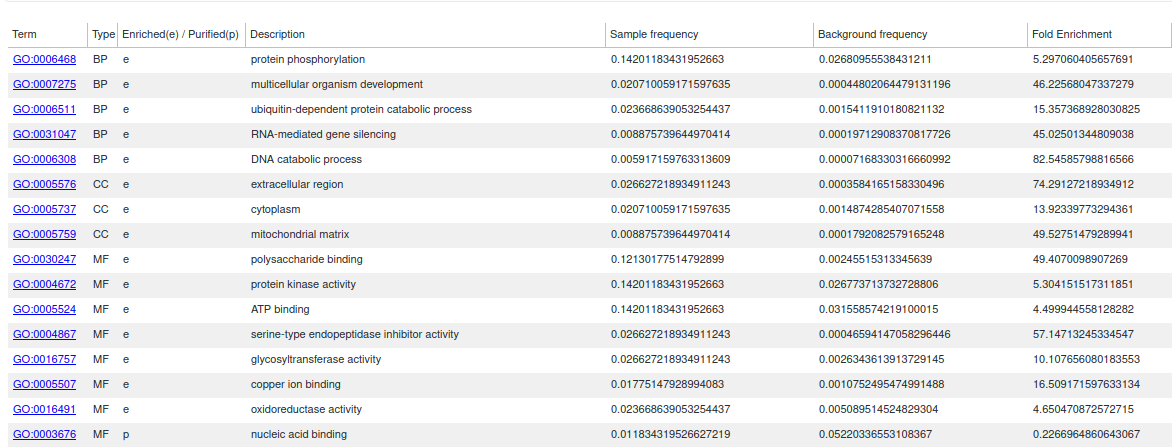
Interactive table with GO enrichment analysis data (image captured below)
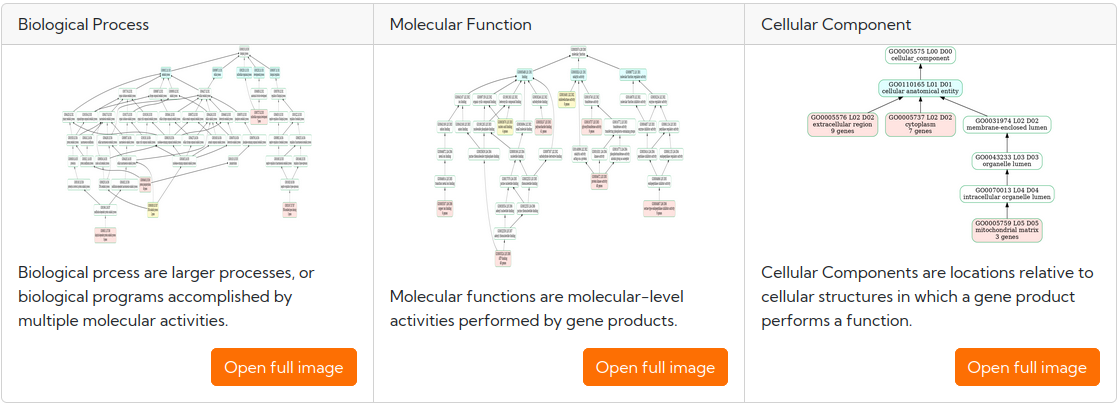
Lineage plot of significant GO terms (image captured below)
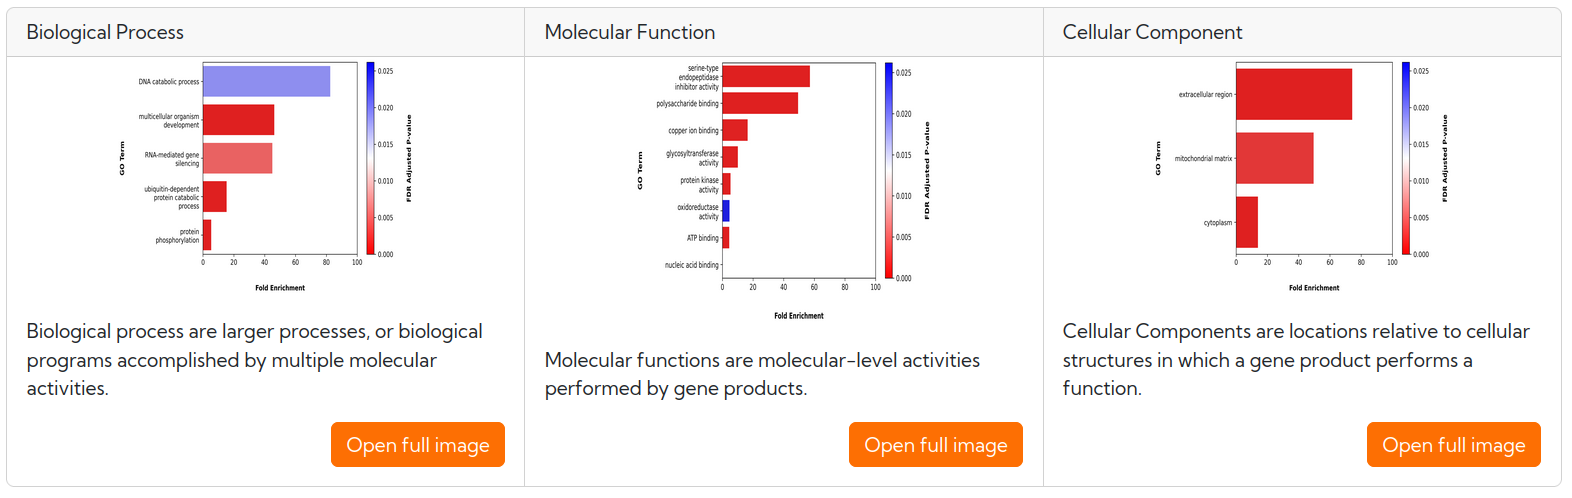
Bar plot of GO terms (image captured below)
Interactive table with GO enrichment analysis data (image captured below)
Lineage plot of significant GO terms (image captured below)
Bar plot of GO terms (image captured below)